 |
OpenNetwork Technologies DirectorySmart 4.6
|
||||||||||||||||||||||||||||||||||||||||||||||||||||||||||||||||
Contents
DisclosureOpenNetwork Technologies sponsored the testing in this report. Mindcraft, Inc. conducted the performance tests described in this report at Sun’s test lab in Langen, Germany. AcknowledgmentWe thank Sun for providing the systems used for the tests and the support staff who helped configure the servers. |
Executive SummaryDirectorySmart 4.6 delivers outstanding performance scaling and achieves the highest login and Extranet sequence rates we've seen to date: 146,051 logins per minute and 25,428 Extranet Sequences (279,708 operations) per minute.Mindcraft® tested OpenNetwork Technologies DirectorySmart 4.6 running on Sun Enterprise servers. For these tests, we used Mindcraft’s iLOAD MVP™ test tool running the AuthMark™ Login and Extranet Scenarios. During these tests DirectorySmart set new performance records for authentication/authorization products while providing almost linear performance scaling. Login ScenarioThe Login Scenario represents the type of load commonly seen at portal sites. It simulates users accessing protected resources via Web servers. The Login Scenario assumes that 10% of a portal's user population logs in concurrently to use portal resources. All tests were done using a 1,000,000-user directory with 100,000 active users. The Login Scenario measures the combination of one user authentication and one authorization for access to a resource (called a Login). The Result Analysis section in the second part of this white paper explains the benchmark results. DirectorySmart, which is located on a Web server for the configurations we tested, is the control point for all authentication and authorization. Our tests were structured to push the Web server systems as closely as possible to 100% CPU utilization. DirectorySmart uses LDAP directory servers to store user authentication and authorization information without an intervening policy/authentication server. So, the performance of DirectorySmart is closely coupled to that of the LDAP directory servers. That is why Table 1 summarizes the Login Scenario performance as a function of the Web and LDAP server configurations. The Scaling Factor in Table 1 shows how much faster a configuration is compared to the smallest configuration, Configuration 1. Table 1: DirectorySmart Login Performance Scalability - 1,000,000-User Directory
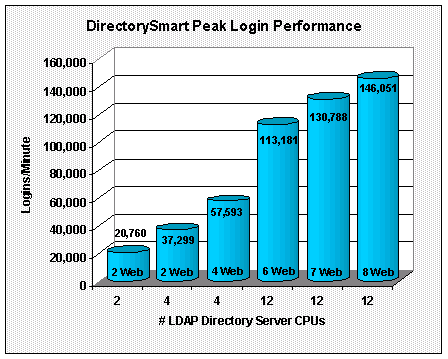
The Web server CPU utilizations for Configurations 3, 5, and 6 show that more performance could have been derived from DirectorySmart. The limiting factor in these cases was the performance of the load generator systems. The LDAP directory server CPU utilizations for all of the tests show that the directory servers could have supported more DirectorySmart-enabled Web servers. Figure 1 shows DirectorySmart's Login performance from Table 1 by the number of LDAP directory server CPUs used. The number of Web servers used is shown in each column. Figure 1: DirectorySmart Login Scalability for a 1,000,000-User Directory
Extranet ScenarioThe Extranet Scenario measures the combination of one user authentication and 10 authorizations for access to resources (these 11 operations constitute one Extranet sequence). The Extranet Scenario, because it uses a more realistic mix of operations than the Login Scenario, provides a better basis for capacity planning purposes. Table 2 shows the DirectorySmart Extranet Scenario performance for Configuration 6 in Table 1 - eight Web servers with four CPUs each and three LDAP directory servers with four CPUs each. The results demonstrate that DirectorySmart performs authorizations faster than it does authentications. Table 2: DirectorySmart Extranet Performance - 1,000,000 User Directory
The Web and LDAP directory server CPU utilizations shown in Table 2 indicate that DirectorySmart could have achieved higher performance. It was the load generator systems, running at 100% CPU utilization, that limited our ability to drive the Web servers with DirectorySmart to their maximum performance. DirectorySmart uses the LDAP directory servers much less for authorizations than it does for logins, which is shown by the 20% CPU utilization for the Extranet Scenario test compared to the 60% to 85% CPU utilizations for the Login Scenario tests. This means that you can plan to deploy more Web servers per LDAP directory server than we used for the Extranet Scenario test. Of course with more DirectorySmart-enabled Web servers, you can expect to achieve higher authorization rates than we did, if your application load is comparable to the one we tested. ConclusionsThe benchmark results lead us to conclude that:
Mindcraft CertificationMindcraft certifies that the results reported accurately represent the performance of OpenNetwork Technologies's DirectorySmart 4.6 running on Sun Enterprise servers configured as specified herein and as measured by AuthMark benchmark. Our test results should be reproducible by others using the same test lab configuration, the same Sun server configurations, and the same software configurations documented in this white paper. Changes
NOTICE: The information in this publication is subject to change without notice. MINDCRAFT, INC. SHALL NOT BE LIABLE FOR ERRORS OR OMISSIONS CONTAINED HEREIN, NOR FOR INCIDENTAL OR CONSEQUENTIAL DAMAGES RESULTING FROM THE FURNISHING, PERFORMANCE, OR USE OF THIS MATERIAL. This publication does not constitute an endorsement of the product or products that were tested. This test is not a determination of product quality or correctness, nor does it ensure compliance with any federal, state or local requirements. Mindcraft is a registered trademark of Mindcraft, Inc. Product and corporate names mentioned herein are trademarks and/or registered trademarks of their respective companies. |
||||||||||||||||||||||||||||||||||||||||||||||||||||||||||||||||
Mindcraft is a registered trademark of Mindcraft, Inc.
Product and corporate names mentioned herein are trademarks and/or registered trademarks of their respective owners.
For more information, contact us at: info@mindcraft.com
Phone: +1 (408) 395-2404
Fax: +1 (408) 395-6324