Hewlett-Packard
|
|||||||||||||||||||||||||||||||||||||||||||||||||||||||||||||||||||||||||||||||||||||||||||||||||||||||||||||||||||||||||||||||||||||||||||
White Paper Contents
|
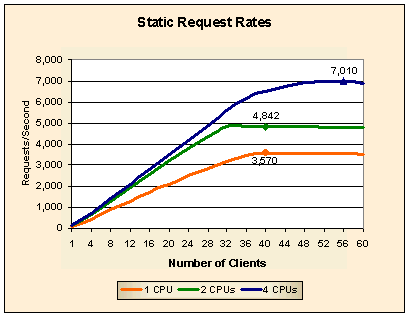
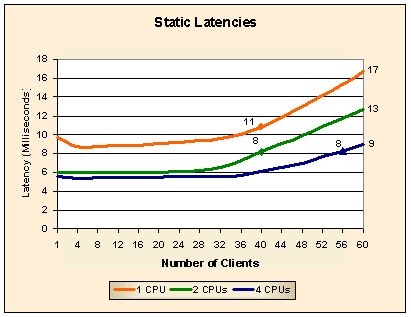
AnalysisThe following analysis will group tests of comparable features and SPI alternatives together to make it easier to compare them. Static TestsThe WebBench static test makes requests for HTML pages stored in files without any additional processing. Its results represent an upper limit on the performance of a Web server. Figures 1 and 2 give the request rate and latency, respectively, for 100% static requests. We will use these static test results to evaluate the SPICE request efficiency of each SPI. Figure 2 shows the latency values both at peak performance (indicated by the marker on each line) and when 60 clients are making requests. Figure 1: Static Request Rate Performance
Figure 2: Static Latency Performance
Table 1 shows the scalability of the NetServer LT 6000r for static requests. We were unable to reach peak performance for the 6-CPU configuration because of the performance limitations of the client systems in our test lab at the time of this test. That's why Table 1 shows the 6-CPU configuration performance as Not Available (NA). Table 1: Static Peak Performance Scaling
Conclusion
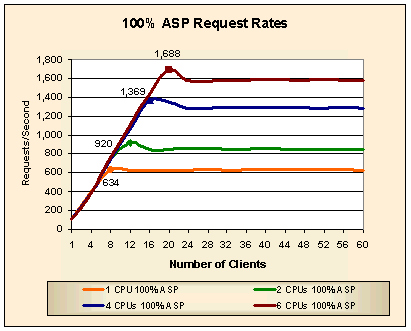
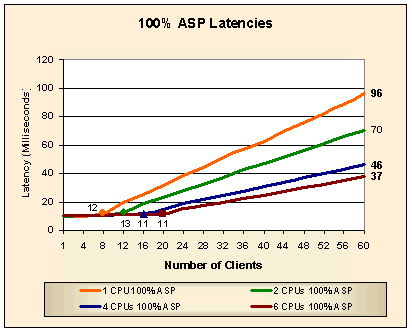
100% ASP and 100% ISAPI TestsWe wrote our SPICE ASP test program in VB Script. Our ISAPI module was written in C to make it as fast as possible. Figures 3 and 4 give the request rate and latency, respectively, for 100% ASP requests. Figure 4 shows the latency values both at peak performance and when 60 clients are making requests. Figure 3: 100% ASP Request Rate Performance
Figure 4: 100% ASP Latency Performance
Table 2 shows the scalability of the NetServer LT 6000r for when all of the HTTP requests are satisfied by an ASP program. Table 2: 100% ASP Peak Performance Scaling
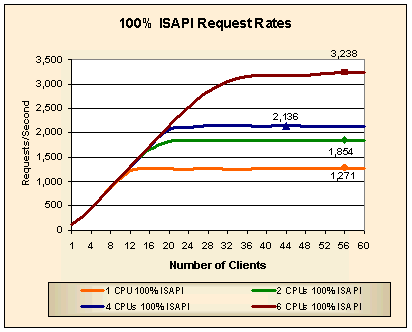
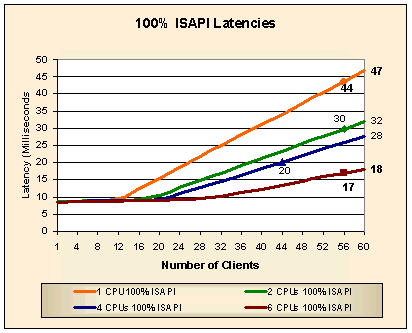
Figures 5 and 6 give the request rate and latency, respectively, for 100% ISAPI requests. Figure 6 shows the latency values both at peak performance and when 60 clients are making requests. Figure 5: 100% ISAPI Request Rate Performance
Figure 6: 100% ISAPI Latency Performance
Table 3 shows the scalability of the NetServer LT 6000r for when all of the HTTP requests are satisfied by an ISAPI module. Table 3: 100% ISAPI Peak Performance Scaling
Conclusions
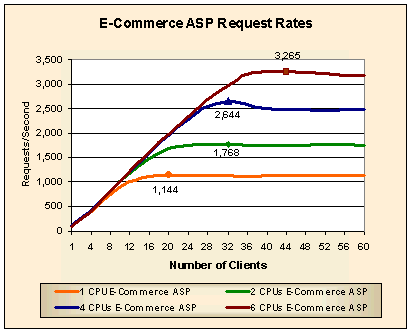
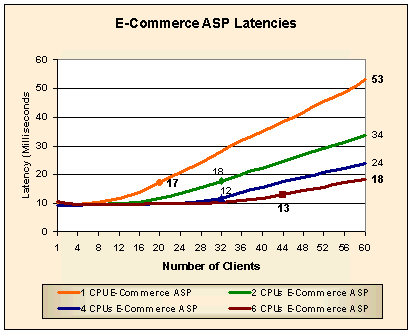
E-Commerce TestsThe WebBench e-commerce tests are a mix of static and dynamic requests using both normal and SSL connections. We substituted our ASP program and C ISAPI module for the standard WebBench dynamic programs in the WebBench e-commerce workload so that we could test and compare performance for these programming interfaces. Figures 7 and 8 give the request rate and latency, respectively, for the e-commerce mix of static and dynamic ASP requests over both SSL and non-SSL connections. Figure 8 shows the latency values both at peak performance and when 60 clients are making requests. Figure 7: E-Commerce ASP Request Rate Performance
Figure 8: E-Commerce ASP Latency Performance
Table 4 shows the scalability of the NetServer LT 6000r for the e-commerce test mix with the dynamic requests satisfied by an ASP program. Table 4: E-Commerce ASP Peak Performance Scaling
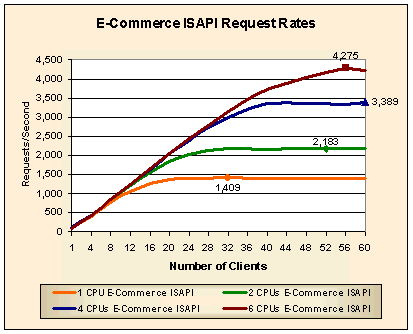
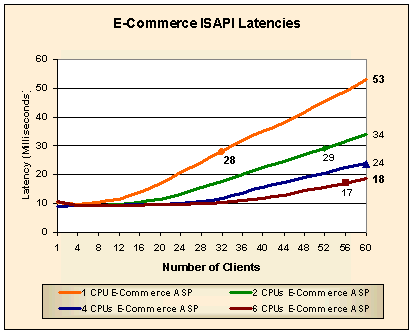
You may notice that the e-commerce ASP request rates are almost twice as high as the 100% ASP request rates. This should be expected because the e-commerce test mix makes static, non-SSL requests 75% of the time. Figures 9 and 10 give the request rate and latency, respectively, for 100% ISAPI requests. Figure 10 shows the latency values both at peak performance and when 60 clients are making requests. Figure 9: E-Commerce ISAPI Request Rate
Performance
Figure 10: E-Commerce ISAPI Latency Performance
Table 5 shows the scalability of the NetServer LT 6000r for the e-commerce test mix with the dynamic requests satisfied by an ISAPI module. Table 5: E-Commerce ISAPI Peak Performance Scaling
You may notice that the e-commerce ISAPI request rates are higher than the 100% ISAPI request rates. This should be expected because the e-commerce test mix makes static, non-SSL requests 75% of the time. Conclusion
Test MethodologyThis section of the white paper describes the testing tool we used, WebBench 3.0, and the special test programs we developed to measure the calling efficiency of a server-side programming interface (SPI) that dynamically generates HTML pages (for example, ASPs or ISAPI modules). We use the term server-side programming interface rather than application programming interface (API) to distinguish that the programs we refer to run on the server and not the client. WebBench 3.0WebBench tests the performance of a Web server by making HTTP GET requests. WebBench increases the stress on a Web server by increasing the number of client test systems (simply called clients) that request URLs. The number of clients at which peak Web server performance is measured is a function of the performance of each WebBench client, the Web server's performance, and the requests made. Thus, it will take more slow clients than fast clients to make a Web server reach its peak performance. This means that the shape of a curve that plots Web server performance against the number of clients participating in a test mix is not significant before the peak performance point. However, the curve is significant after the peak performance point because it shows how well a Web server handles an overload. WebBench can generate a heavy load on a Web server. To do this in a way
that makes benchmarking economical, each WebBench client sends an
HTTP request to the Web server being tested and waits for the reply.
When it comes, the client immediately makes a new HTTP request. This
way of generating requests means that a few test systems can
simulate the load of hundreds of users. You need to be careful,
however, not to correlate the number of WebBench client test systems
with the number of simultaneous users that a Web server can support
since WebBench does not behave the way users do. WebBench MetricsWebBench produces a standard set of reports as a spreadsheet workbook. The Summary Report provides two metrics as a function of the number of clients participating in a test mix: the number of HTTP GET requests/second a Web server can satisfy and the corresponding throughput measured in bytes sent/second. The peak request rate is a useful measurement for comparing Web servers and SPIs. A larger number of requests/second means that one product can handle a larger load than the alternative. However, the peak request rate is also a function of the average size of a response. For example, a Web server responding only to static requests for files averaging 14 KB might perform at 1,000 requests/second. However, if the average file size requested drops to 500 bytes, that same Web server would respond at a significantly higher rate, perhaps 2,500 requests/second. So when we compare request rates we must be careful to look at the average size of the responses. This was a motivating factor for Mindcraft developing the SPICE Benchmark specification. The throughput measurements in the WebBench Summary Report are useful for determining the average response size at each request rate and for seeing what the peak number of bytes sent across the network is. Because throughput is equal to the number of requests/second times the average response size in bytes, you can easily find the average response size given the request rate. WebBench also provides a detailed Client Data Report showing a great deal of information for each client in each test mix. The average latency across all clients in a test mix is included in this report. Latency is defined as the time from starting a connection to a Web server to send a request until the last byte of the response is received. Latency is especially interesting to look at because it will indicate how long a user will have to wait to have a request satisfied. WebBench Test Scenarios and WorkloadsWebBench comes with several standard tests. Each test is divided into two parts: a workload and a test scenario. Except for the standard static test, Mindcraft either modified a WebBench test or created a new one in order to do the tests for this white paper. The following is a description of each test we ran:
We used HTTP 1.0 without keepalives for all of our tests, just like the standard WebBench 3.0 tests. SPICE TestsThe programs we developed test Server-side Programming Interface Call Efficiency, or simply SPICE. We developed the concept of SPICE tests:
SPICE tests use applications that do the minimum processing needed to return the same average number of bytes as a static test will return. This means that SPICE tests can be used to make fair comparisons between static-only, dynamic-only, and mixed static-dynamic test scenarios. Because SPICE test programs return the same amount of data as the average static request, the response rate for the SPICE programs is not artificially inflated over the static data response rate. A SPICE test essentially measures the minimum overhead for using a particular SPI. A common alternative to SPICE tests is to simulate a real-world application. One obvious problem with this alternative is that the simulated application will almost certainly behave differently than the one you want to deploy. While that is also true with SPICE programs, they have an advantage over simulated applications because they are simpler to implement, smaller and use fewer resources. This simplicity and size advantage lets you use SPICE programs to evaluate the true overhead of using a SPI as well as making it much easier to develop and run a test. Of course, if you have your own real application available, you are much better off using it to make your comparisons than a SPICE test. SPICE MetricsYou can use almost any Web server performance measurement tool to do SPICE tests as long as it supports executing a program that does the minimum processing necessary to return the same number of bytes as a static test. Of course, if your tool returns a different average number of bytes than WebBench, you will have to modify your SPICE programs to return the correct number of bytes. For SPICE tests, your tool needs to make two types measurements: the number of requests/second the Web server delivers and the average latency for requests. We call these the SPICE request rate and the SPICE latency, respectively. The SPICE request rate is useful for comparing Web server performance under load. It incorporates the performance of the server hardware, the server operating system, the Web server software, and the SPI. It is based on aggregating the performance of all of the requests from all of the client systems used in a test. Comparing Web server performance based on SPICE request rate results in a server-centric comparison. Evaluating Web server and SPI performance solely based on the SPICE request rate can be misleading. The SPICE request rate will always be the upper bound of your server's peak performance, unless your application does almost nothing. You can improve the validity of your evaluation by incorporating SPICE latency. Using SPICE latency to evaluate Web server and SPI performance helps you make decisions from a user perspective. You can think of SPICE latency as answering the question, "How long will I have to wait to get a response if I try to use a server with the current load on it?" The answer to this question will give you an idea of how responsive a user will find your Web application. By looking at the SPICE latency on each client system, you can see if a Web server is handling client requests unequally and if the clients (your future users) will experience an unacceptably long wait for a response. If either of these undesirable conditions is true, the useful peak performance of the Web server is lower than the peak performance you are measuring. You can determine the useful peak performance by finding the maximum performance point at which the Web server treats client requests equally and at which it has an acceptable SPICE latency. SPICE latency also is useful to estimate the response time a user will experience from a lightly loaded server. Simply add the SPICE latency to the time it takes your application to do its job and your estimate is done. Unfortunately, this simple addition will not be accurate for a heavily loaded server because your real application will take up CPU time, memory and other resources thereby increasing the actual latency. Finally, the SPICE latency curve will show you how responsive you server will be as the load increases. We define SPICE request efficiency as the ratio of the SPICE request rate divided by the static request rate. In other words: SPICE request efficiency = SPICE request efficiency is a measure of how much dynamic request performance using a particular SPI will degrade from that of static-only requests. Configuration DetailsHP NetServer LT 6000rWe used the same NetServer LT 6000r for all of the test reported here. We used the directive numproc= in the boot.ini file to specify at boot time how many CPUs to use . Table 6 shows the system configuration. Table 6: NetServer LT 6000r Configuration
Windows 2000 and IIS 5We made the following Windows 2000 configuration and tuning changes:
We used the Microsoft Visual C/C++ compiler, version 6 for compiling the C ISAPI modules. Test LabMindcraft's test lab consists of three types of systems for a total of 60 clients:
All of the clients were connected to an HP ProCurve 4000M switch via a full-duplex 100Base-TX link. The ProCurve 4000M has two full-duplex Gigabit Ethernet links, which were used to connect the server. We used an independent system to be the WebBench controller. This controller was also connected to the ProCurve 4000M switch. Table 7: Type A Client Configuration
Table 8: Type B Client Configuration
Table 9: Type C Client Configuration
|
||||||||||||||||||||||||||||||||||||||||||||||||||||||||||||||||||||||||||||||||||||||||||||||||||||||||||||||||||||||||||||||||||||||||||
|
|
NOTICE: The
information in this publication is subject to change without notice. MINDCRAFT, INC. SHALL
NOT BE LIABLE FOR ERRORS OR OMISSIONS CONTAINED HEREIN, NOR FOR
INCIDENTAL OR CONSEQUENTIAL DAMAGES RESULTING FROM THE FURNISHING,
PERFORMANCE, OR USE OF THIS MATERIAL. This
publication does not constitute an endorsement of the product or
products that were tested. This test is not a determination of
product quality or correctness, nor does it ensure compliance with
any federal, state or local requirements. Mindcraft
is a registered trademark of Mindcraft, Inc. The Mindcraft
tests discussed herein were performed without independent
verification by Ziff-Davis and Ziff-Davis makes no representations
or warranties as to the results of the tests. Product and corporate names mentioned herein are trademarks and/or registered trademarks of their respective companies. |
||||||||||||||||||||||||||||||||||||||||||||||||||||||||||||||||||||||||||||||||||||||||||||||||||||||||||||||||||||||||||||||||||||||||||
|
|
|
|
|
|
|
|
|||||||||||||||||||||||||||||||||||||||||||||||||||||||||||||||||||||||||||||||||||||||||||||||||||||||||||||||||||||||||||||||||||||
|
|
Copyright ©
1999-2000. Mindcraft, Inc. All rights reserved. |
